Online Statistics Course
 Learn to gather, process and apply statistical data, for business, research or any other purpose.
- Self paced course that caters equally to the slow or fast learner
- Support from experts trained in statistics at university, and experienced in the use of statistics in the real world
Statistics involves gathering, organising and analysis of data (normally numerical). In enables us to draw conclusions and make inferences on the basis of such analyses.
Descriptive statistics describe a set of data, while inferential statistics make inferences about large groups based on data from a smaller subset of the group. To infer means to draw a conclusion based on facts or premises. Thus an inference is the end result; a proposition based on the act of inferring.
Statistical data is critical to management of every commercial or government enterprise. Without statistics, our understanding of society, and the physical world; not to mention economics; would be greatly diminished.
COURSE STRUCTURE
There are 10 lessons as follows:
- Introduction
- Distributions
- Measures of central tendency
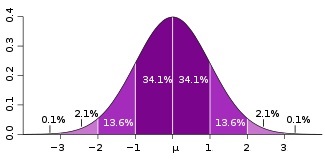
- The Normal curve and Percentiles and Standard Scores
- Correlation
- Regression
- Inferential Statistics
- The t Test
- Analysis of variance
- Chi square test
Each lesson culminates in an assignment which is submitted to the school, marked by the school's tutors and returned to you with any relevant suggestions, comments, and if necessary, extra reading.
What is in each lesson?
1. Introduction
- Key terms and concepts: data, variables
- Measurements of scale: nominal, ordinal, interval, ratio
- Data presentation
- Probability
- Rounding of data
- Scientific notation
- Significant figures
- Functions
- Equations
- Inequalities
- Experimental design
- The normal curve
- Data collection
- Simple, systemic, stratified and cluster random sampling
- Remaining motivated to learn statistics
2. Distributions
- Scope and nature of distributions
- Class intervals and limits
- Class boundaries
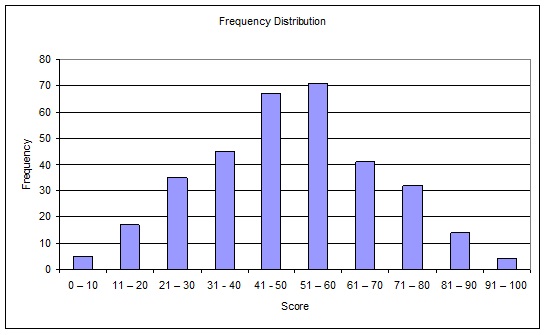
- Frequency Distribution
- Histograms
- Frequency polygons
- Normal distributions
- Other distributions
- Frequency curves
3. Measures of central tendency
- Range, percentiles, quartiles, mode, median, mean
- Variance
- Standard deviation
- Degrees of freedom
- Interquartile and semi interquartile deviations
4. The Normal curve and Percentiles and Standard Scores
- Normal distribution characteristics
- Percentiles
- Standard scores
- Z scores
- T score
- Converting standard scores to percentiles
- Area under a curve
- Tables of normal distribution
5. Correlation
- Scope and nature of Correlation
- Correlation coefficient
- Coefficient of determination
- Scatter plots
- Product movement for linear correlation coefficient
- Rank correlation
- Multiple correlation
6 Regression
- Calculating regression equation with correlation coefficient
- Least squares method
- Standard error of the estimate
7. Inferential Statistics
- Hypothesis testing
- Test for a mean
- Errors in accepting or rejecting null hypothesis
- Levels of significance
- One and two tailed tests
- Sampling theory
- Confidence intervals
8. The t Test
- Assessing statistical difference with the t test
- t Test for independent samples
- t Test for dependant (paired) samples
9. Analysis of variance
- Scope and application of ANOVA
- Factors and levels
- Hypothesis
- Calculate degrees of freedom
- Calculate sum of squares within and between groups
- Calculate mean square
- Calculate F
10. Chi square test
- Chi square goodness of fit test
- Calculate degrees of freedom
- Chi square test of independence
- Calculate expected frequencies
- Degrees of freedom
- Contingency tables
- Find expected frequencies
- Calculate degrees of freedom
WHAT THE COURSE COVERS
Here are just some of the things you will be doing:
- To familiarise the student with different statistical terms and the elementary representation of statistical data.
- To familiarize the student with distributions, and the application of distributions in processing data.
- To apply measures of central tendency in solving research questions
- Demonstrate and explain the normal curve, percentiles and standard scores.
- To understand the methods of correlation that describes the relationship between two variables.
- To make predictions, with regression equations and determine how much error to expect, when making the predictions.
- To understand the basic concepts of underlying the use of statistics to make inferences.
- To examine the difference between the means of two groups with the t Test.
- Understand the use of ANOVA (Analysis of Variance) in analysing the difference between two or more groups.
- To introduce and apply the concept of Non Parametric Statistics.
The Language of Statistics
Data – simply means information, usually in statistics this means numerical data (numbers).
Data may be raw (numerically unorganised) or in arrays (organised into ascending or descending order of magnitude). The difference between the largest and the smallest value in the array gives us the range.
Variables -A variable is a quantity or value denoted by a symbol. However in statistics we take this a step further, often in statistics we study living things, and not surprisingly they differ, often greatly between themselves. So variables are also measures of characteristics which may differ. If it only ever has one value then it is a constant (ie: it is not a variable!). If it can only assume definite values, then it is known as a discrete variable (e.g. the number of children in a family, N, can only be a whole number). If it can assume a value between two given variables then it is known as a continuous variable (e.g. the height of an individual, H, could be 170cm, 170.7cm, 170.79461cm depending on the accuracy of the measurement)
Nominal – the use of names to help measure variables. Variables measured on such a scale are known as categorical or qualitative variables. In this type of scale, variable may be assigned to descriptive categories, for example gender may be either male or female. Each category may then be assigned a number that does not denote importance, rank or size. The number is arbitrary. For example; blonde = 1, black = 2, grey = 3 and brown = 4.
Ordinal – the order in which things occur. Eg. 1,2,3,4…. Unlike the numbers assigned arbitrarily in nominal scales, in ordinal scales the numbers do imply rank on a continuous scale.
The scale used depends on the variable it is describing. Hence a race would rank accordingly from first place to last. The winner would be 1, second place 2 and so on. Note that the information here is only about rank and it does not describe the variability within placements. For example in a horse race we might know that racehorse 1 came first, and racehorse 2 came second, but we are not told about how close together these racehorses were.
Interval – the ‘distance’ between two or more values. eg. Differences in temperature. The distinguishing feature of interval scales is the lack of an absolute zero point. The characteristic cannot be not there, hence zero on the scale does not imply absence. The units used in such a scale are measured equally, but because zero does not imply absence, we cannot measure the ratio between values.
Ratio – the relationship between two or more values. eg. Differences in the height or weight of objects. The same as an interval scale with equal distances along the scale meaning the same thing no matter where on the scale you are except that zero on the scale does represent the absence of the variable being measured. Thus we can measure ratios, for example 4 apples is twice as much as 2 apples.
ENROL & LEARN MORE -Study one step at a time, and gradually build a solid grasp of this subject in your own time.
